
Executive Sales & Bidding Analytics Suite
A connected suite of executive dashboards and reporting workflows at Kewaunee Scientific that turns CRM, quoting, and project data into decision-ready views for sales, engineering, estimating, operations, and leadership.
Professional work · private systems · Jun 2025 – Present

Data Analyst at Kewaunee Scientific: dashboards, KPI definitions, data models, CRM data quality, and stakeholder requirements.

- Executive dashboards
- 20+Power BI and Zoho Analytics.
- KPI visualizations
- 100+Used across sales, engineering, estimating, and operations.
- CRM records validated
- 2,000+Cleaned, validated, and restructured.
The problem
Operational records arrive with inconsistent definitions and formats, while leadership needs clear, dependable answers about sales, bids, quotes, and project status. A dashboard is only as trustworthy as the definitions and data underneath it.
My contribution
Since June 2025 I have worked as a data analyst at Kewaunee, meeting directly with sales leadership and other stakeholders, translating their questions into data models and DAX measures, and building and maintaining the dashboards they use.
What I built
I build and maintain executive Power BI and Zoho Analytics reporting across sales performance, bidding activity, quote conversion, project pipelines, and expiration tracking, backed by standardized KPI definitions, data dictionaries, and automated recurring reports.
- 20+ executive dashboards and 100+ KPI visualizations.
- Data models and DAX measures built from stakeholder requirements.
- 2,000+ CRM records cleaned, validated, and restructured for reliable downstream KPIs.
- Standardized KPI definitions, data dictionaries, and automated recurring metric reports.
How it works
Every view starts from the decision a stakeholder needs to make and works backward to validated data.
- Stakeholder question
- Source records + validation
- Data model, DAX measures, KPI definitions
- Executive dashboards
- Automated recurring reporting

Key decisions
Start from the decision.
Each dashboard begins with what a stakeholder is trying to decide, which keeps views small and usable instead of chart-heavy.
Make shared definitions explicit.
Standard KPI definitions and data dictionaries mean a number means the same thing in every report.
Fix the data, not just the chart.
Cleaning and restructuring CRM records improved accuracy at the source, which made downstream KPIs more reliable.
Outcomes & evidence
One request from the VP of Sales called for tracking projects expiring across day, week, month, and year windows with several other components, a structure the analytics platform did not support directly. Through documentation, iteration, and a workaround, I delivered a live expiration-tracking dashboard that leadership now uses.
The suite now includes 20+ executive dashboards and 100+ KPI visualizations, supported by 2,000+ cleaned CRM records and shared metric definitions.
Scope & limits
This is private professional work. The visuals on this page are illustrative and contain no company data, internal screenshots, or proprietary schemas.
What I learned
Definitions and data quality often decide whether a dashboard can support a real decision.
Built with
Related writing
More projects

Flowcast
Hourly taxi-demand forecasts for all 262 NYC zones, with a public model card.
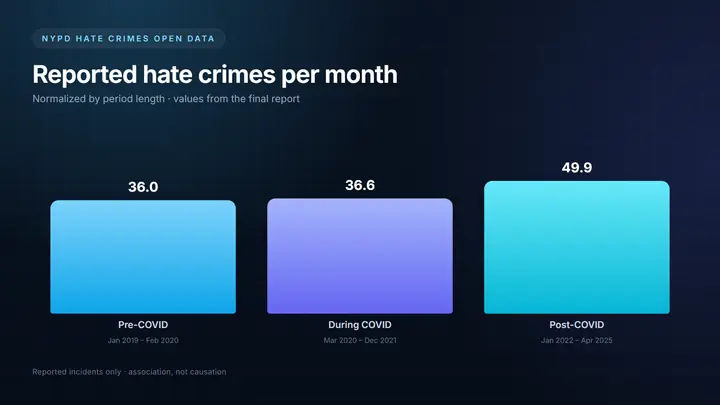
NYPD Crime Data Analysis
A statistical study of reported hate-crime patterns before, during, and after COVID-19.

Census Data Analysis
A team research paper on how education, age, sex, and race relate to salary.


