
SecondChance
A student research prototype that uses Austin Animal Center's public intake and outcome records to estimate, at intake, which animals may need extra support, and turns those estimates into a practical weekly workflow.
Live public site · team project · Jul – Sep 2026
Designed and built the web application and the project presentation. Research and modeling were shared across the team.
Four-person UNC Charlotte team (DTSC 3601): Davis Higgins, Bennett Shearin, Seth Sumter, and Hunter Pace.

- ROC AUC · adopted by day 30
- 0.8033,217 held-out stays, from the published model artifact.
- ROC AUC · stay past 60 days
- 0.6943,079 held-out stays, from the published model artifact.
The problem
Shelter teams have limited time and need to know which animals may benefit from extra attention early in a stay. Public intake and outcome records can help, but only if their limits are respected: transfers are not adoptions, open records are not a verified adoptable roster, and a ranking is not proof that acting on it changes outcomes.
My contribution
SecondChance is a four-person UNC Charlotte project. The research and modeling were shared by the team. I designed and built the web application, which turns the team's work into a usable product, and I built the project presentation.
What I built
The site connects a shelter overview, a support queue, browsable records, an outreach planner, and plain-language methodology pages. Every figure is defined once in a metric registry that feeds the dashboard tiles, chart notes, record pages, and glossary, and each page distinguishes observed outcomes, model estimates, and planning assumptions.
- Overview: open-stay counts, headline figures with a "what this means" note, trends, and model context.
- Support queue: intake-time estimates beside actual waits, with URL-backed filters.
- Record pages: stay timelines, recorded facts, data-quality notes, and suggested support.
- Planner: builds a weekly outreach plan from available capacity, exportable as CSV or print.
How it works
Public feeds are validated and paired into stays before any model sees them, and the site reads every metric from one committed model artifact.
- City of Austin intake + outcome feeds
- Validation and paired stays
- Team modeling: two calibrated LightGBM classifiers
- Committed model artifact
- Next.js overview · queue · records · planner
Socrata feeds validated with Zod; rejected rows are counted, never silently dropped.
Two LightGBM classifiers, calibrated with isotonic regression on a later validation block and tested on a still-later block.
Next.js and TypeScript pages that read the artifact directly, with tests that replay the trainer's golden vectors.

Key decisions
Answer at intake.
Both estimates use only what is known when an animal arrives, and validation is time-based, so the scores reflect what a team could actually know.
Define each metric once.
A single registry holds each figure's meaning, unit, formula, window, sample, and limitation, so the same number never means two things on two pages.
Frame risk as a reason to help.
A higher long-stay estimate points to added support. The site says "potential benefit," never "animals saved."
Outcomes & evidence
The live prototype makes the team's predictive work usable through defined metrics, browsable records, and a practical planning workflow. The published model artifact reports ROC AUC of 0.803 for 30-day adoption and 0.694 for stays past 60 days on held-out data, with calibration and subgroup checks reported on the site.
Scope & limits
SecondChance is a student research prototype and is not affiliated with the Austin Animal Center. It identifies animals that may need support; no one has shown that acting on the queue changes outcomes, which would require a prospective study. The model reflects one shelter in one city and would need local retraining elsewhere.
What I learned
A model becomes useful when its estimates are translated into a clearly defined workflow, and a team project is stronger when every contribution stays visible.
Built with
More projects

Flowcast
Hourly taxi-demand forecasts for all 262 NYC zones, with a public model card.

Census Data Analysis
A team research paper on how education, age, sex, and race relate to salary.
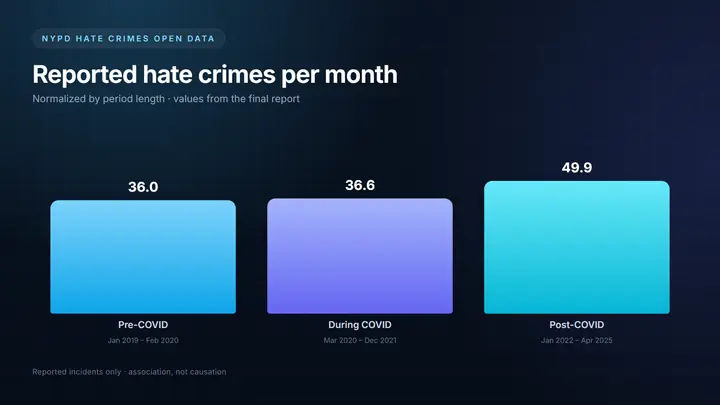
NYPD Crime Data Analysis
A statistical study of reported hate-crime patterns before, during, and after COVID-19.


